# Browser connect
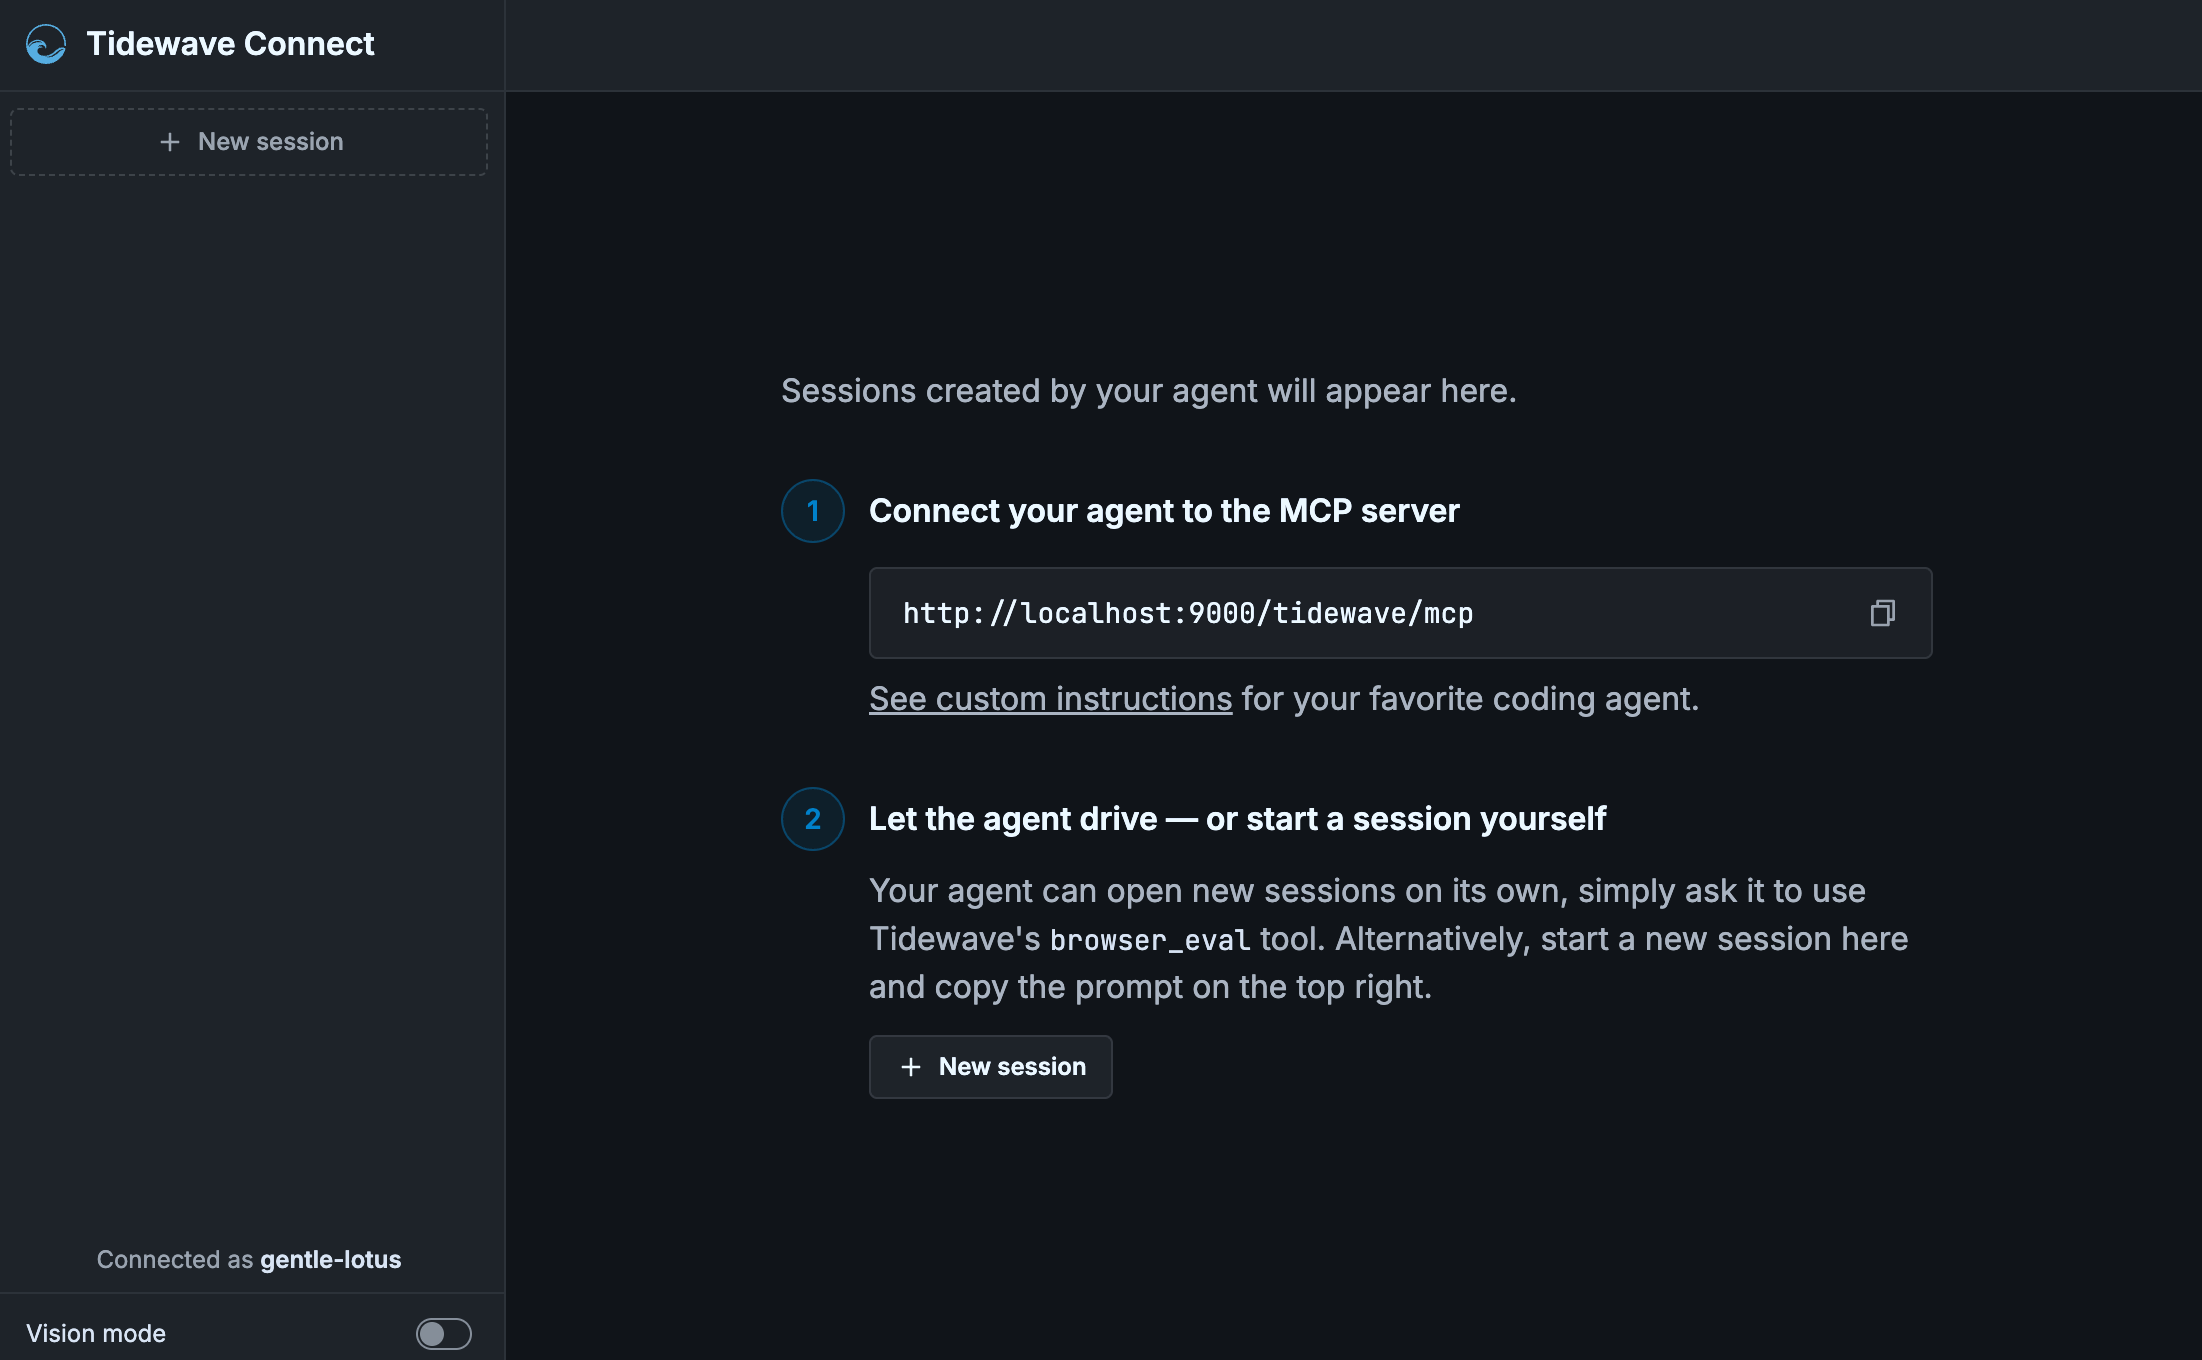
Tidewave Connect allows your coding agent to connect to your browser and control your web application:
It is similar to tools like [Playwright](https://playwright.dev) or the browser in your editor, with a few notable differences:
* **Uses your browser**: Tidewave uses your existing browser and sessions, making it much easier for the agent to see and debug the same page you are working with
* **Error handling**: Because Tidewave understands your framework, it automatically recognizes error pages and feeds stacktraces, logs, framework metadata to the agent
* **Vision mode**: [Tidewave's vision mode](vision_mode.md) includes the ability to record videos with captions, narration, and other bells and whistles for proof of work
To enable Tidewave Connect, simply install the [Tidewave MCP](../mcp/mcp.md) in your coding agent of choice and ask it to use the `browser_eval` tool. You will need to also open up your web app at `/tidewave` in your browser of choice.
## Managing connections
Tidewave connects your coding agent to your browser via your web app. If your app is running on `localhost:4000`, your coding agent should connect to `localhost:4000/tidewave/mcp` and you should open up your browser at `localhost:4000/tidewave`, and now your coding agent will be able to control your browser. Consequently:
* You can open up `localhost:4000/tidewave` in three different browsers and your coding agent should be capable of managing sessions on each of them
* Each Tidewave Connect session is per domain/origin, due to browser restrictions. Therefore, if your application runs on `localhost:4000` and `admin.localhost:4000`, you will likely require two Tidewave Connect sessions
* Similarly, if you want to manage remote sessions, such as `myapp.staging.example.com`, you simply need to connect your coding agent to `myapp.staging.example.com/tidewave/mcp` and open `myapp.staging.example.com/tidewave` in your browser, and you are good to go
## Viewport
Tidewave Connect offers the ability to customize the viewport, allowing developers to simulate different devices. To use it, click on the display icon on the top right:
Once enabled, you can either select one of the available presets or type custom dimensions.
The viewport is also available to coding agents. This means coding agents can automatically test and verify breakpoints. For example, you can ask how your app renders on mobile and the agent will match what the code says with how the app behaves in practice:
 It is similar to tools like [Playwright](https://playwright.dev) or the browser in your editor, with a few notable differences:
* **Uses your browser**: Tidewave uses your existing browser and sessions, making it much easier for the agent to see and debug the same page you are working with
* **Error handling**: Because Tidewave understands your framework, it automatically recognizes error pages and feeds stacktraces, logs, framework metadata to the agent
* **Vision mode**: [Tidewave's vision mode](vision_mode.md) includes the ability to record videos with captions, narration, and other bells and whistles for proof of work
To enable Tidewave Connect, simply install the [Tidewave MCP](../mcp/mcp.md) in your coding agent of choice and ask it to use the `browser_eval` tool. You will need to also open up your web app at `/tidewave` in your browser of choice.
## Managing connections
Tidewave connects your coding agent to your browser via your web app. If your app is running on `localhost:4000`, your coding agent should connect to `localhost:4000/tidewave/mcp` and you should open up your browser at `localhost:4000/tidewave`, and now your coding agent will be able to control your browser. Consequently:
* You can open up `localhost:4000/tidewave` in three different browsers and your coding agent should be capable of managing sessions on each of them
* Each Tidewave Connect session is per domain/origin, due to browser restrictions. Therefore, if your application runs on `localhost:4000` and `admin.localhost:4000`, you will likely require two Tidewave Connect sessions
* Similarly, if you want to manage remote sessions, such as `myapp.staging.example.com`, you simply need to connect your coding agent to `myapp.staging.example.com/tidewave/mcp` and open `myapp.staging.example.com/tidewave` in your browser, and you are good to go
## Viewport
Tidewave Connect offers the ability to customize the viewport, allowing developers to simulate different devices. To use it, click on the display icon on the top right:
It is similar to tools like [Playwright](https://playwright.dev) or the browser in your editor, with a few notable differences:
* **Uses your browser**: Tidewave uses your existing browser and sessions, making it much easier for the agent to see and debug the same page you are working with
* **Error handling**: Because Tidewave understands your framework, it automatically recognizes error pages and feeds stacktraces, logs, framework metadata to the agent
* **Vision mode**: [Tidewave's vision mode](vision_mode.md) includes the ability to record videos with captions, narration, and other bells and whistles for proof of work
To enable Tidewave Connect, simply install the [Tidewave MCP](../mcp/mcp.md) in your coding agent of choice and ask it to use the `browser_eval` tool. You will need to also open up your web app at `/tidewave` in your browser of choice.
## Managing connections
Tidewave connects your coding agent to your browser via your web app. If your app is running on `localhost:4000`, your coding agent should connect to `localhost:4000/tidewave/mcp` and you should open up your browser at `localhost:4000/tidewave`, and now your coding agent will be able to control your browser. Consequently:
* You can open up `localhost:4000/tidewave` in three different browsers and your coding agent should be capable of managing sessions on each of them
* Each Tidewave Connect session is per domain/origin, due to browser restrictions. Therefore, if your application runs on `localhost:4000` and `admin.localhost:4000`, you will likely require two Tidewave Connect sessions
* Similarly, if you want to manage remote sessions, such as `myapp.staging.example.com`, you simply need to connect your coding agent to `myapp.staging.example.com/tidewave/mcp` and open `myapp.staging.example.com/tidewave` in your browser, and you are good to go
## Viewport
Tidewave Connect offers the ability to customize the viewport, allowing developers to simulate different devices. To use it, click on the display icon on the top right:
 Once enabled, you can either select one of the available presets or type custom dimensions.
The viewport is also available to coding agents. This means coding agents can automatically test and verify breakpoints. For example, you can ask how your app renders on mobile and the agent will match what the code says with how the app behaves in practice:
Once enabled, you can either select one of the available presets or type custom dimensions.
The viewport is also available to coding agents. This means coding agents can automatically test and verify breakpoints. For example, you can ask how your app renders on mobile and the agent will match what the code says with how the app behaves in practice: