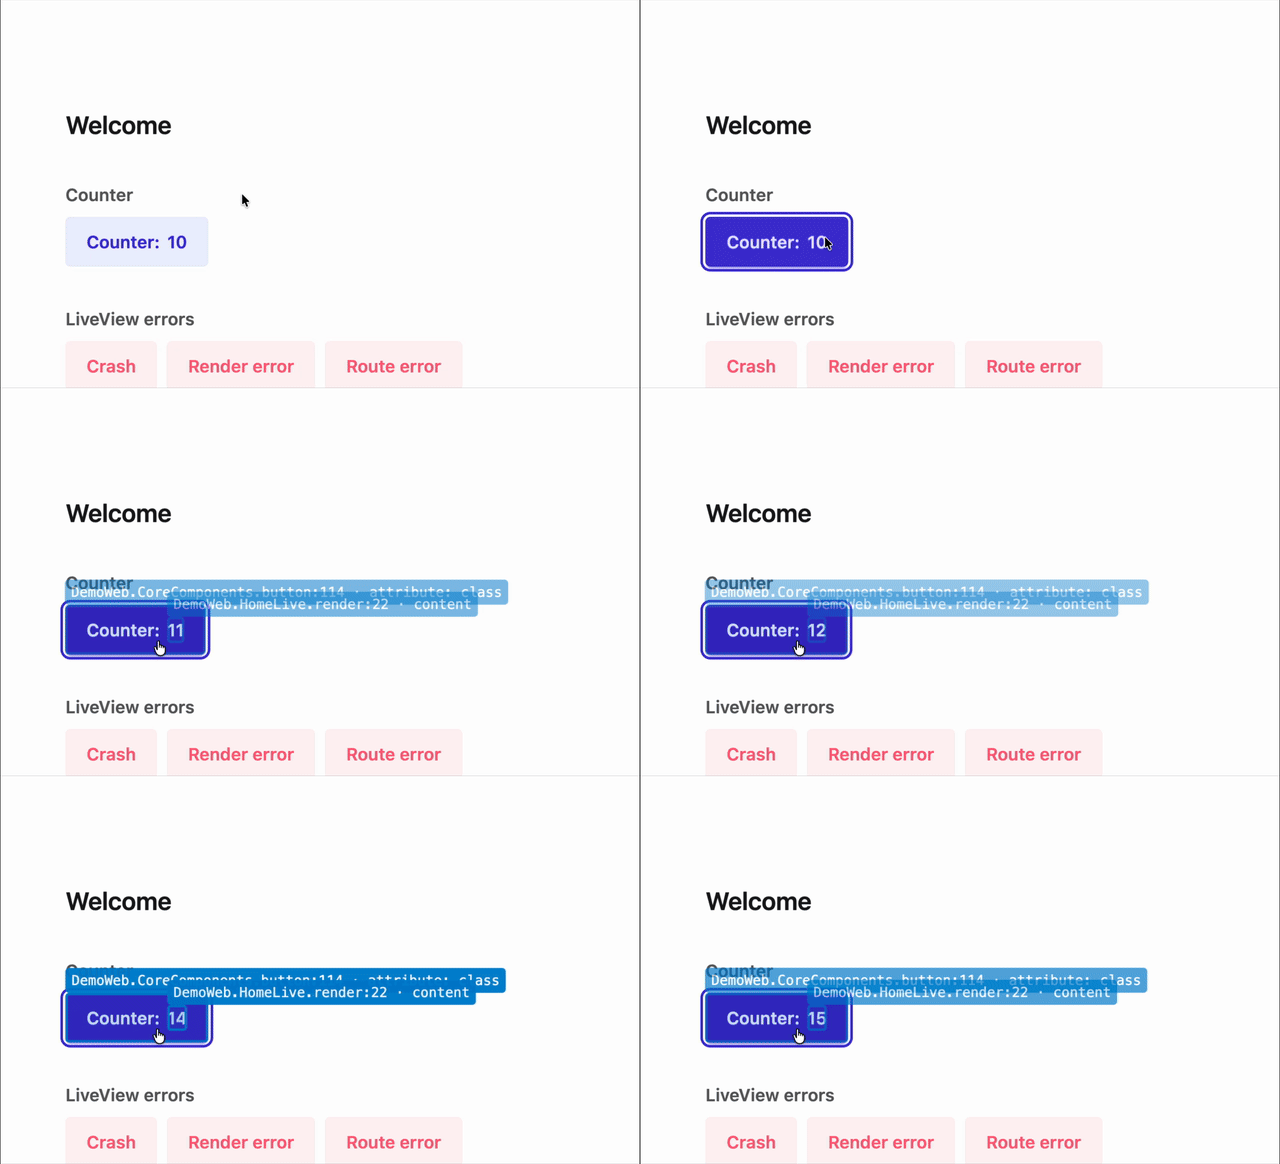
You can use the Tidewave Toolbar and the Tidewave IDE to highlight parts of your page as they change. It helps you understand which interactions update the DOM, but also which interactions cause framework specific changes, such as visualizing the diff from a Phoenix LiveView server render.
Tidewave IDE
The update visualizer is available in the Tidewave IDE by clicking the visualizer icon on the top right. It has the same functionality as the toolbar.
Usage
Click the pulse icon in the Tidewave Toolbar to open Visualize updates, then enable one or more visualizations:
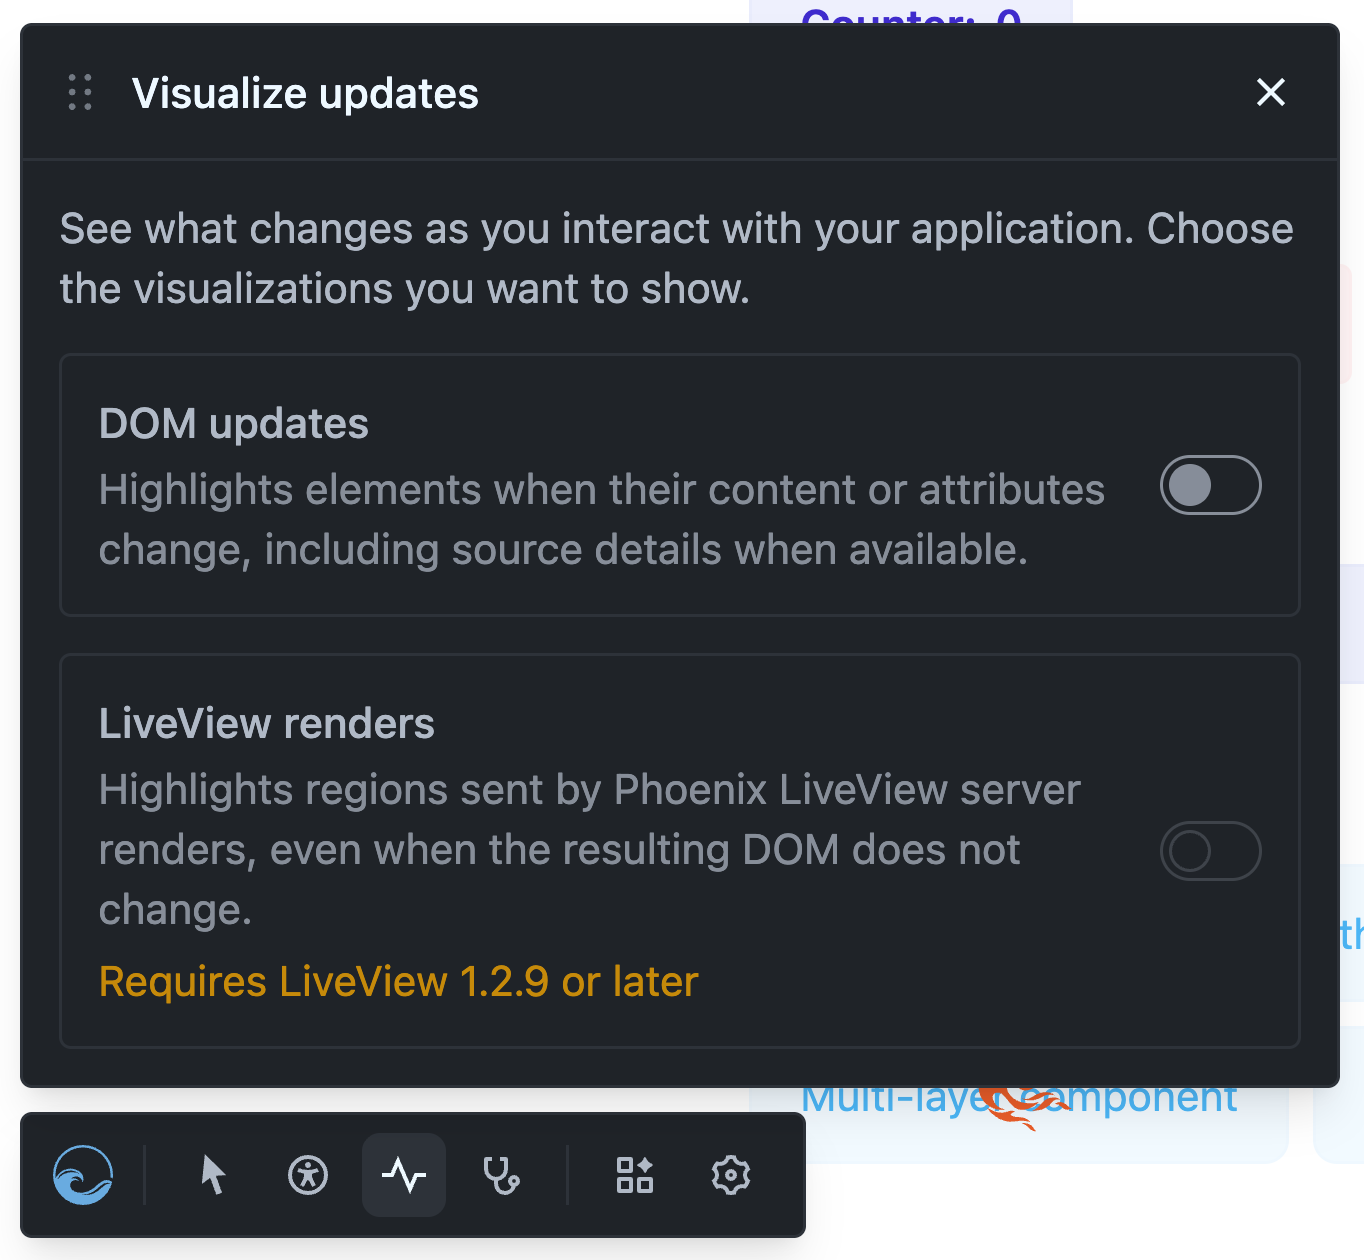
| Visualization | What it shows | Availability |
|---|---|---|
| DOM updates | Elements whose content or attributes change in the DOM | All applications |
| LiveView renders | Regions included in a Phoenix LiveView server render, even when the resulting DOM does not change | Phoenix LiveView 1.2.9 or later |
| React re-renders | React components that re-render, even when the resulting DOM does not change | React applications |
| Vue re-renders | Vue components that re-render, even when the resulting DOM does not change | Vue applications |
Note that only available options are shown. If you are using the Toolbar with a Rails app, the LiveView option won't be shown.
The visualizations remain active after you close the panel. Reopen it and disable their toggles when you no longer need them. Your selections are preserved when you reload the page in the same browser tab.
Each update appears as a colored outline that fades after a moment. Its label identifies the component and line that rendered the element when source information is available. It also describes whether content or attributes changed. Hold Ctrl (Cmd on macOS) while an outline is visible to show the source location instead.
DOM updates
DOM updates observes actual changes to the page, including text and child elements being added, replaced, or removed, as well as changed attributes. This is based on a MutationObserver. It works independently of the framework, so it also captures updates made directly by client-side JavaScript.
This visualization reflects the final DOM. It cannot detect a render that produces the same value already present on the page because no DOM mutation occurs.
LiveView renders
LiveView renders complements DOM updates by showing the regions touched by a diff from the LiveView server. It can therefore reveal a dynamic expression that was rendered and sent again even if its value, and consequently the DOM, stayed the same. This is useful for spotting unexpected renders and investigating how much data an interaction causes LiveView to send.
LiveView render labels distinguish content from attribute updates and include an approximate size for the associated diff value.
LiveView version
LiveView render visualization requires Phoenix LiveView 1.2.9 or later. With an older version, the toggle is disabled.
For precise HEEx component names and source locations, enable LiveView's development annotations:
config :phoenix_live_view,
  debug_heex_annotations: true,
  debug_attributes: true
These options are enabled by default in the dev.exs config file of new Phoenix apps.
React/Vue re-renders
Both modes highlight components whenever they re-render, including renders that do not result in any DOM changes. This makes it useful for spotting unexpected or unnecessary renders and understanding which components are affected by an interaction.