When using the Tidewave Toolbar and Tidewave IDE, Tidewave watches it for runtime problems and reports them in the Diagnostics panel. Reports can come from your web framework or from unhandled JavaScript errors and are collected while you use the application.
Additionally, whenever your coding agent is navigating your application through Tidewave Connect or Tidewave IDE, Tidewave will include any page diagnostics it finds in tool call reports, allowing your agent to find and fix bugs that would not be found by static analysis.
Similar to accessibility diagnostics, the page diagnostics emitted by Tidewave are also augmented with framework trace and metadata, allowing Tidewave to point the exact page and elements that triggered them whenever possible.
Tidewave IDE
Page diagnostics are available in the Tidewave IDE by clicking the diagnostics icon on the top right. It has the same functionality as the toolbar.
Usage
Open the Diagnostics panel by clicking the diagnostics icon. A badge on the icon shows the number of collected reports.
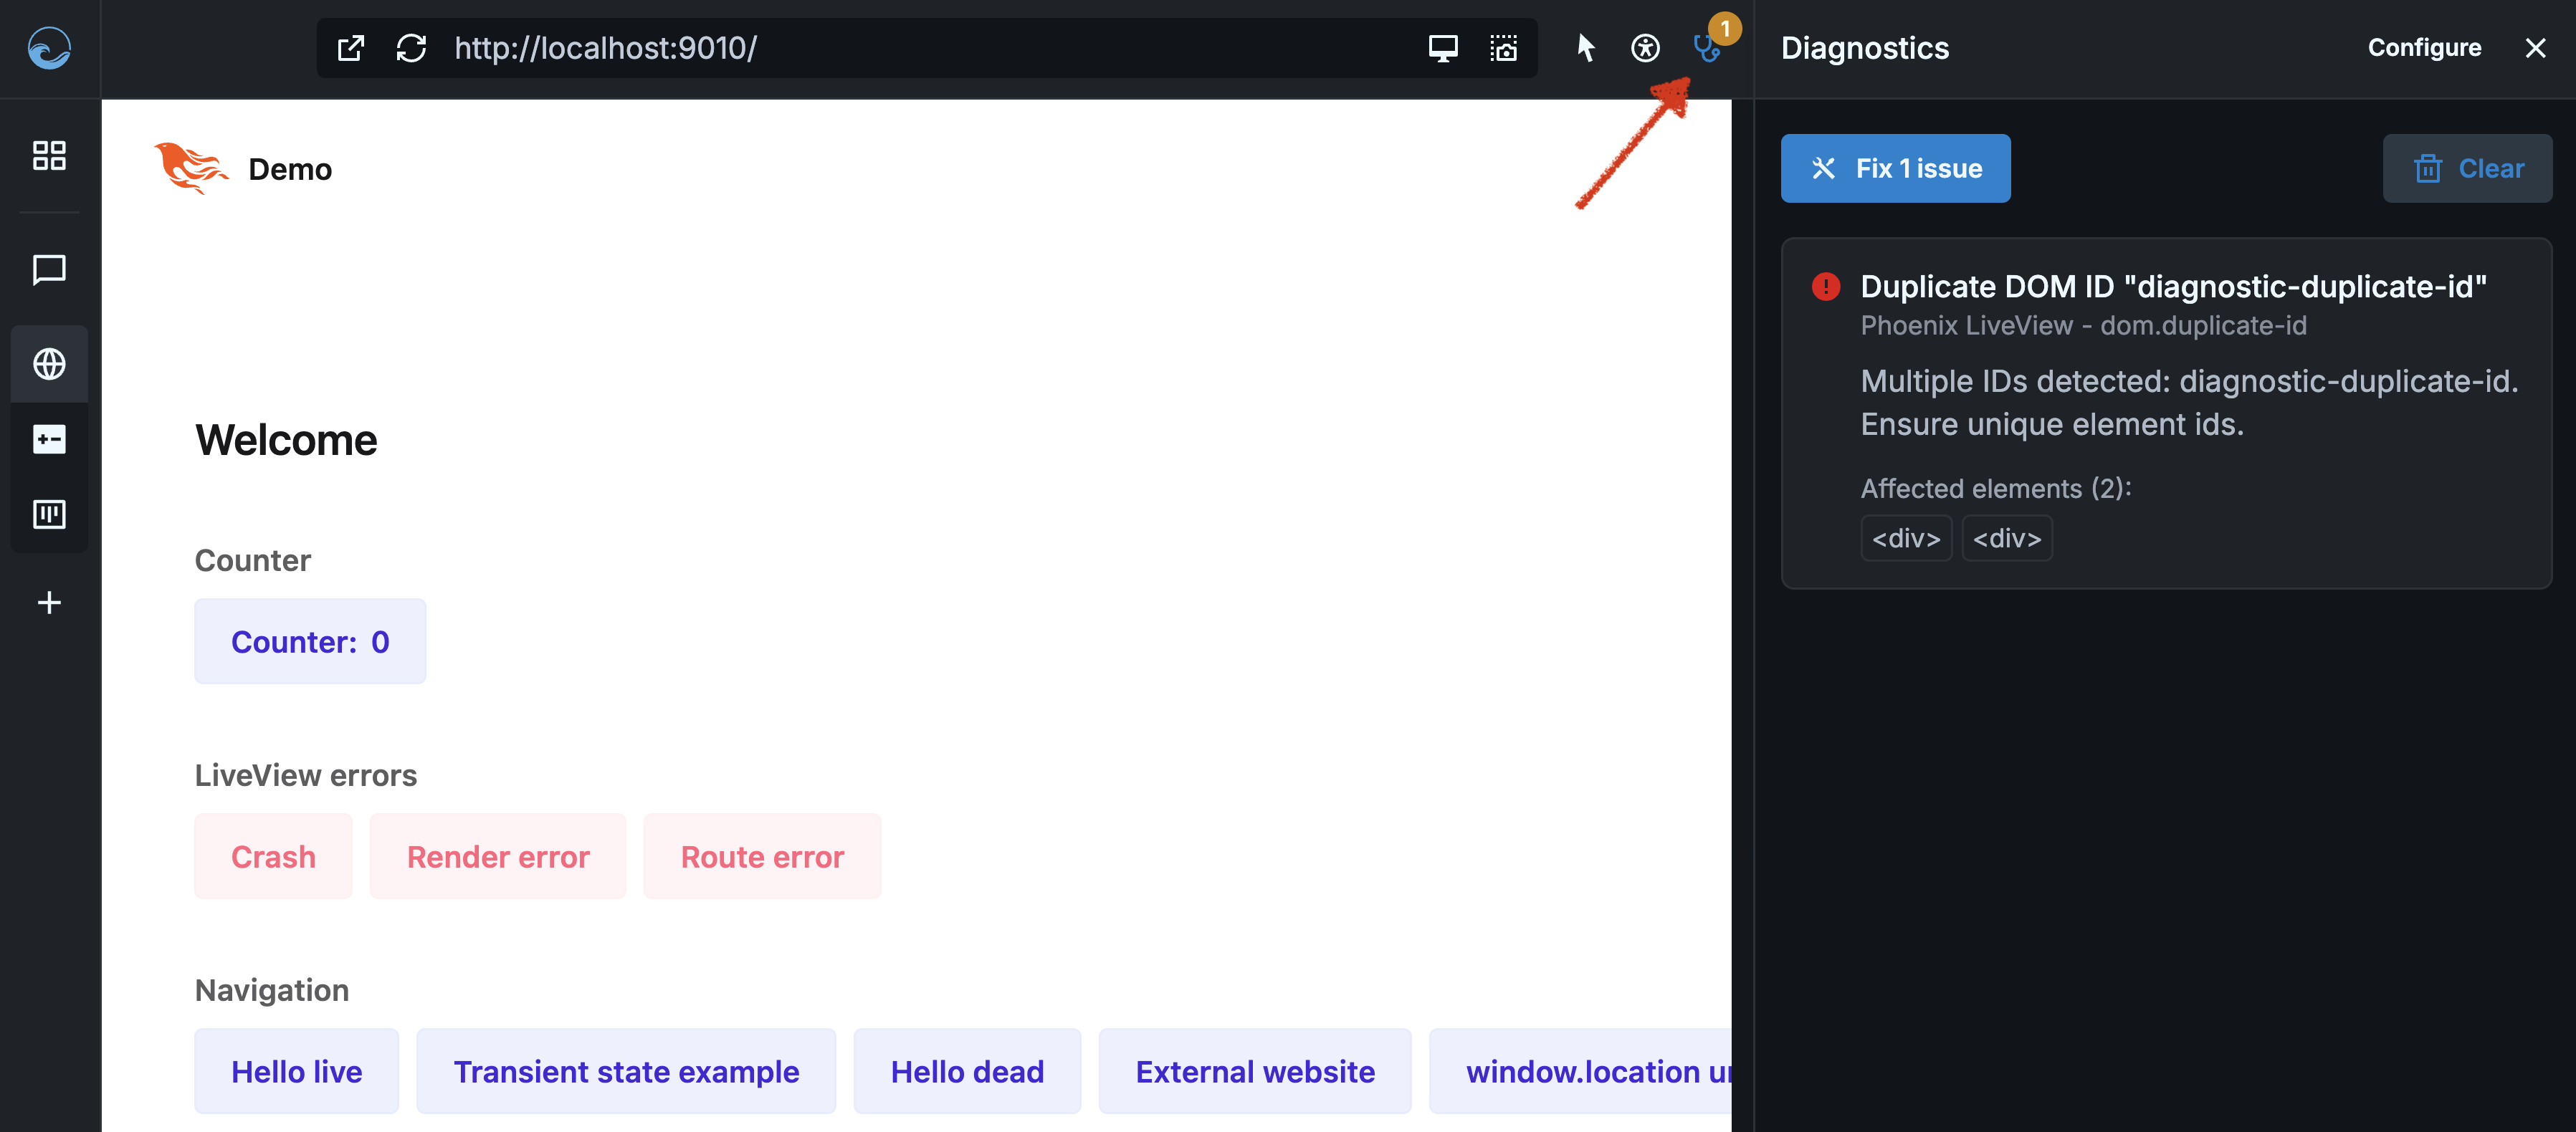
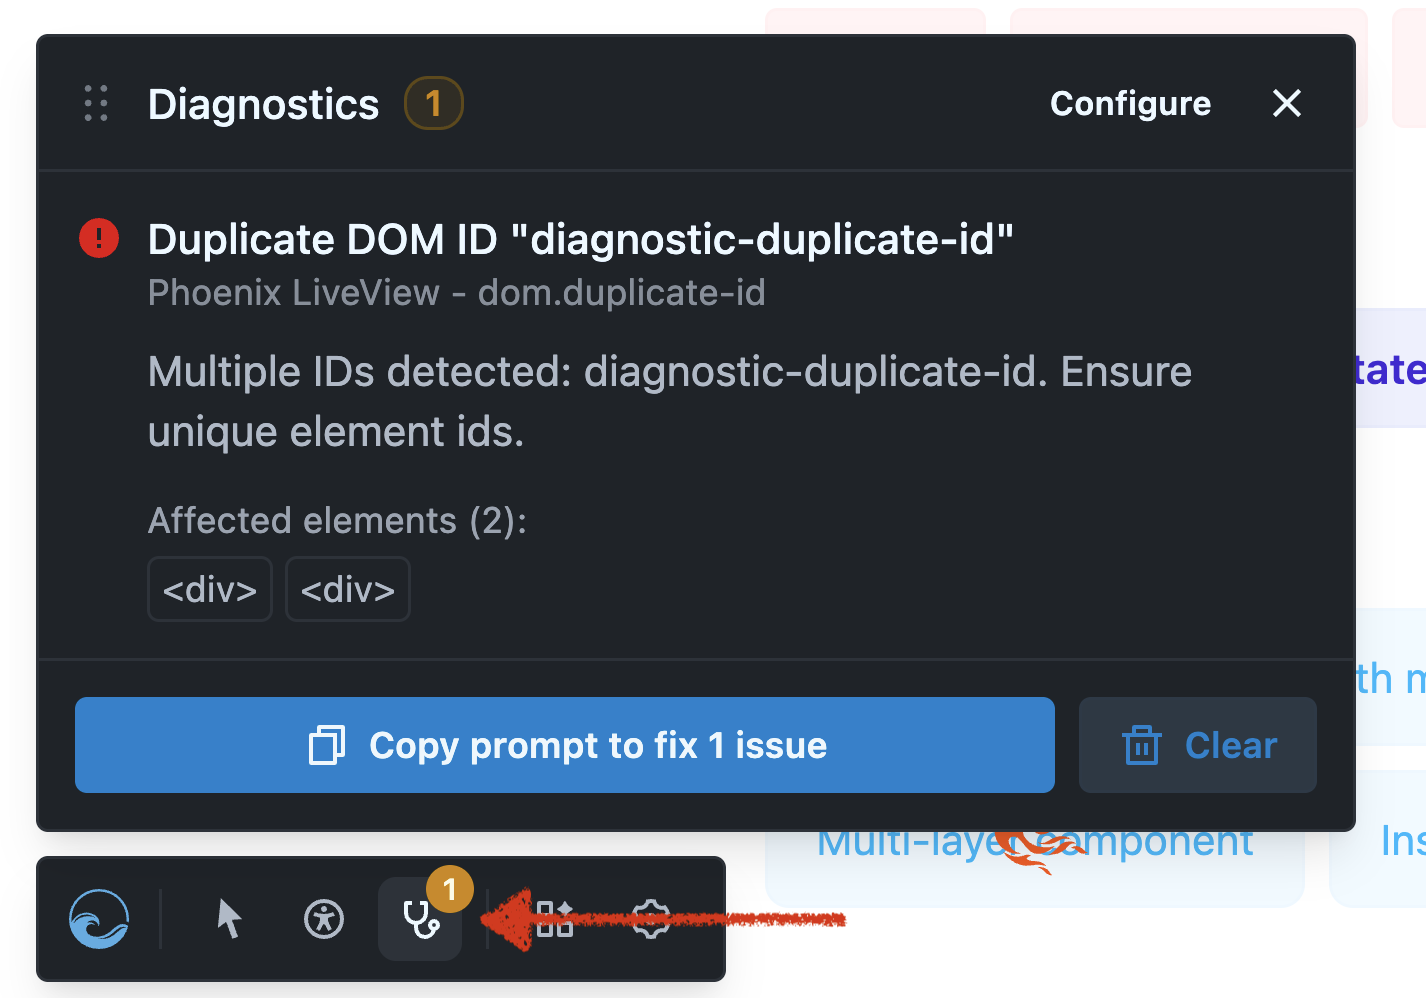
Each report includes the source, diagnostic type, severity, and a description of the problem. When a report identifies affected elements, hover an element button to highlight it on the page. Tidewave also attaches the element's selector and framework rendering information to the report, helping the coding agent find the relevant source code.
You can select individual reports if you only want to address some of them. By default, all diagnostics are selected. Below we list the diagnostics we find per runtime/framework.
Phoenix (LiveView) diagnostics
Tidewave turns application-level diagnostics emitted by Phoenix LiveView into reports with a suggested fix. It currently recognizes problems involving, among others:
Duplicate DOM IDs, invalid stream containers, invalid children of
phx-updatecontainers, and form inputs namedidInvalid DOM bindings, like
phx-debounce/phx-throttlevalues, orphx-targetselectors that do not match an elementHooks that are missing an ID, unknown, invalid, attached to a disconnected element, or fail during initialization
Invalid colocated hooks and custom elements that do not create their hook after connecting to the DOM
Missing or duplicate LiveView upload inputs
When LiveView includes elements in a diagnostic, Tidewave adds their selectors and HEEx component information to the prompt. Enable debug_heex_annotations and debug_attributes in your Phoenix development configuration to get the most precise source information.
Validate LiveView navigation
When building LiveView applications, it is common to use the patch operation to update the current LiveView and reflect its state in the URL (address bar). However, when patching a LiveView, one could accidentally rely on socket.assigns that were loaded by another action. In such cases, if you were to reload the page in the browser, LiveView would crash as certain assigns would be missing.
To detect such bugs, for every LiveView patch operation, Tidewave automatically fetches the whole page behind the scene and see if it returns a successful status code. If not, it emits a diagnostic. The report guides the coding agent to ensure that mount/3 and handle_params/3 reconstruct the required assigns from the URL, session, or persistent data instead of relying on state established by handle_event/3.
This check is enabled by default. You can turn it on or off under Settings > Diagnostics > Validate LiveView navigation or by clicking Configure in the Diagnostics panel.
Rails diagnostics
Tidewave reports uncaught errors from Stimulus and identifies the affected element when Stimulus provides one. No additional work is necessary for tracking Turbo requests, as those failures are automatically included in server logs.
JavaScript diagnostics
For every supported framework, Tidewave reports uncaught JavaScript errors and unhandled promise rejections. When available, the report includes a source-mapped stack trace so the coding agent can trace the failure back to application source code.